University of Pittsburgh, Pittsburgh, PA
ABSTRACT
Increased skin temperature is one of the least explored risk factors for pressure ulcer. Previous animal and human studies revealed local cooling has a protective effect on tissue under pressure, however the underlying mechanism remains unclear. The purpose of this pilot study was to analyze the blood flow signal using the spectrogram (magnitude-square STFT) and compare the reactive hyperemia between cooling and non-cooling. Ten subjects were recruited, and laser Doppler flowmetry was used to collect the blood flow data. Wideband and narrowband spectrograms were computed, from which normalized post-occlusion energy density spectra were calculated and compared for pressure application with and without cooling. Our results showed that the spectrogram allowed us to compare the differences between cooling and non-cooling within the four target frequency bands of physiological responses. Findings from this study may direct further investigation on distinguishing different physiological response of the skin under local cooling using STFT.
KEYWORDS
pressure ulcers; laser Doppler flowmetry (LDF); short-time Fourier transform; spectrogram
BACKGROUND
Pressure ulcers remain a serious healthcare problem for people with spinal cord injury. Previous animal studies have shown that increased skin temperature is related to more severe tissue damage when pressure is applied to the skin for a prolonged period of time (1). Our pilot study on human subjects showed that local cooling has a protective effect on skin under prolonged pressure (2). We hypothesized that this enhanced tolerance to pressure with cooling is due to a decreased metabolic rate compensating for decreases in oxygen supply. Tissue metabolism increases 10% per °C (3). However, the time domain analysis of Laser Doppler flowmetry (LDF) blood flow parameters reported in our pilot study (normalized peak skin blood flow (SBF), time to peak SBF, and perfusion area) did not reveal the blood flow control mechanism influenced by the cooling protocol. LDF is a non-invasive blood flow measurement tool widely used in pressure ulcer studies on human subjects. In this study, we use LDF to quantify the reactive hyperemic response, the sudden increase in skin blood flow occurring after occlusion removal. Reactive hyperemia is a normal physiological response of the skin that occurs right after ischemia relief whose intensity and duration has been shown to correspond to the magnitude and duration of the ischemic event. Many different time-domain parameters have been used to quantify the reactive hyperemia, however none of these parameters can be attributed to specific blood flow control mechanisms such as the blood vessel smooth muscle myogenic or metabolic responses. Such mechanism associated blood flow information is revealed when the signal is analyzed in the frequency domain. Bracic & Stevnovska (4) revealed that the skin perfusion signal contained intricate frequency components, and each frequency band represents different mechanisms; e.g. metabolic (0.008-0.02 Hz), neurogenic (0.02-0.05 Hz), myogenic (0.05-0.15 Hz), respiratory (0.15-0.4 Hz), and cardiac (0.4-2.0Hz).
Many signals, especially biological and biomedical signals, are nonstationary, in that their characteristics change over time. A particularly important characteristic is the frequency content of a signal, and discerning whether or not this changes over time. Standard Fourier spectral analysis cannot accomplish this goal, as it reveals only what frequencies occurred in the signal, but not when they occurred. Breaking the signal up into short-time segments and Fourier analyzing each part is one way to ascertain if and how the spectral properties of the signal are changing. This approach to time-frequency analysis is called the short-time Fourier transform (STFT), the magnitude-square of which is the spectrogram (5). In this study, we applied the STFT to blood flow signals to compare differences between cooling and non-cooling within different physiologically relevant frequency bands.
STATEMENT OF THE PROBLEM
The objective of this pilot study was to investigate the protective mechanism associated with local cooling to the skin under localized prolonged pressure using short-time Fourier analysis of the skin blood flow. We hypothesized that the normalized post-occlusion energy density spectrum within the metabolic frequency band (0.008-0.02 Hz) would be significantly different following prolonged pressure application when the skin is cooled compared to when the skin is not cooled.
METHODS
Subject and Research Design
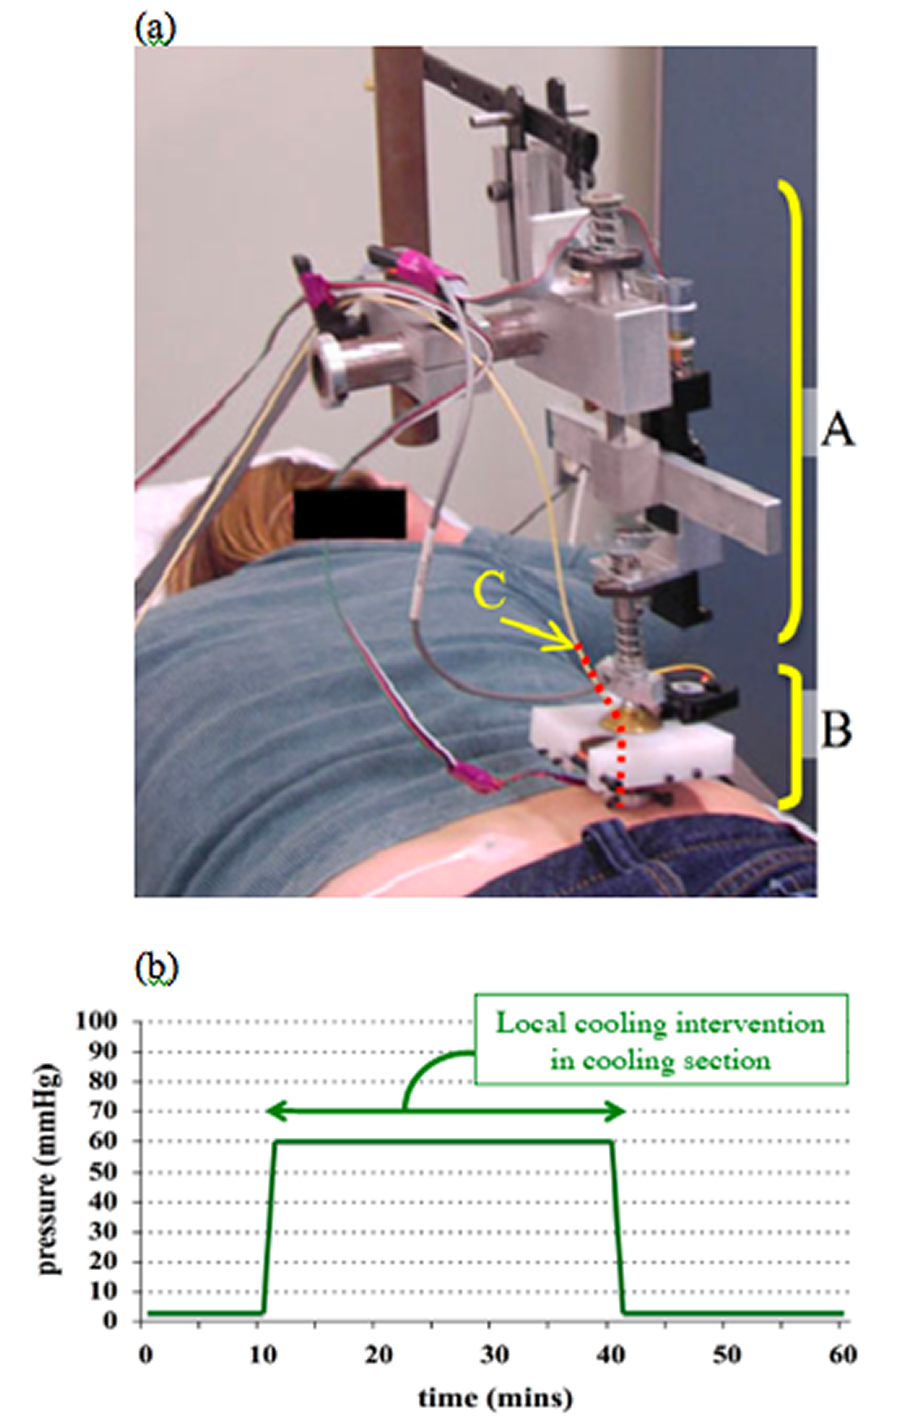
Figure 1: Test Setting and Pressure Application Pattern (Click for larger view)
Ten (five male, five female) young healthy human subjects (mean value ± standard deviation, 28.31 ± 4.23 years) participated in this study. The Institutional Review Board of the University of Pittsburgh approved the protocol. The subjects had no history of smoking and were free of any cardiopulmonary, vascular disease, hypertension or diabetes. Subjects also had not taken any medication that affects the cardiovascular system or eaten within 12 hours prior to the study. The subjects lay prone while the blood flow tests were performed on the skin over the right side of sacrum (figure 1(a)). This study used a repeated measures design with two test sessions: cooling and non-cooling (control). Pressure application was the same for both test session and consisted of: 4kPa (3mmHg) for 10 minutes, 8kPa (60mmHg) for 30 minutes, and 4kPa for 20 minutes. For the cooling session, local cooling was applied through the pressure applicator during the period of 8kPa pressure (figure 1(b)).
Instrumentation and Data Analysis
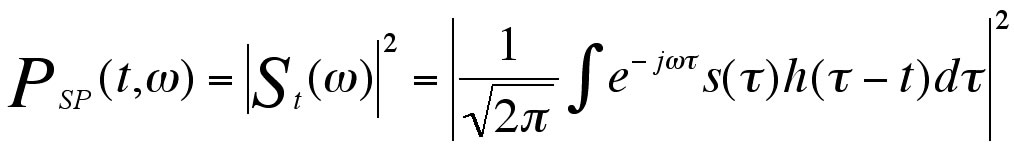
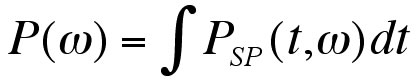
Our customized test system provided integrated pressure and temperature control through PID controllers. Skin blood flow data was measured with the LDF device and sampled at a rate of 0.5Hz. Details of the instrumentation were previously published (2). Wideband and narrowband spectrograms (Eq. 1) were calculated for each blood flow signal, using window lengths (WLEN) of 64 and 256 samples, corresponding to window durations of 128 sec and 512 sec, respectively. The spectrograms were computed using Matlab. In fig. 2(a), an example spectrogram is plotted (main color panel), along with the frequency marginal (left panel, and Eq. 2) and the signal (bottom panel). The spectrograms and frequency marginal are plotted on a logarithmic amplitude scale (dB). Equations for generating the spectrogram and frequency marginal are as followed (5):
Equation 1: Equation of Spectrogram
Equation 2: Equation of Frequency Marginal
For the purpose of statistical analysis, we integrated the spectrograms over different time and frequency regions of interest to obtain various power measurements. Baseline energy density spectra of each frequency band were compared between cooling and non-cooling. In addition, normalized post-occlusion energy density spectrum of each frequency band was compared between the cooling and non-cooling test sessions (Eq. 3). Paired t-test and Wilcoxon signed rank tests were used for normally and non-normally distributed data.
Equation 3: Equation of Normalized Post-Occlusion Energy Density Spectrum

RESULTS
Spectrogram of the Skin Perfusion Signal
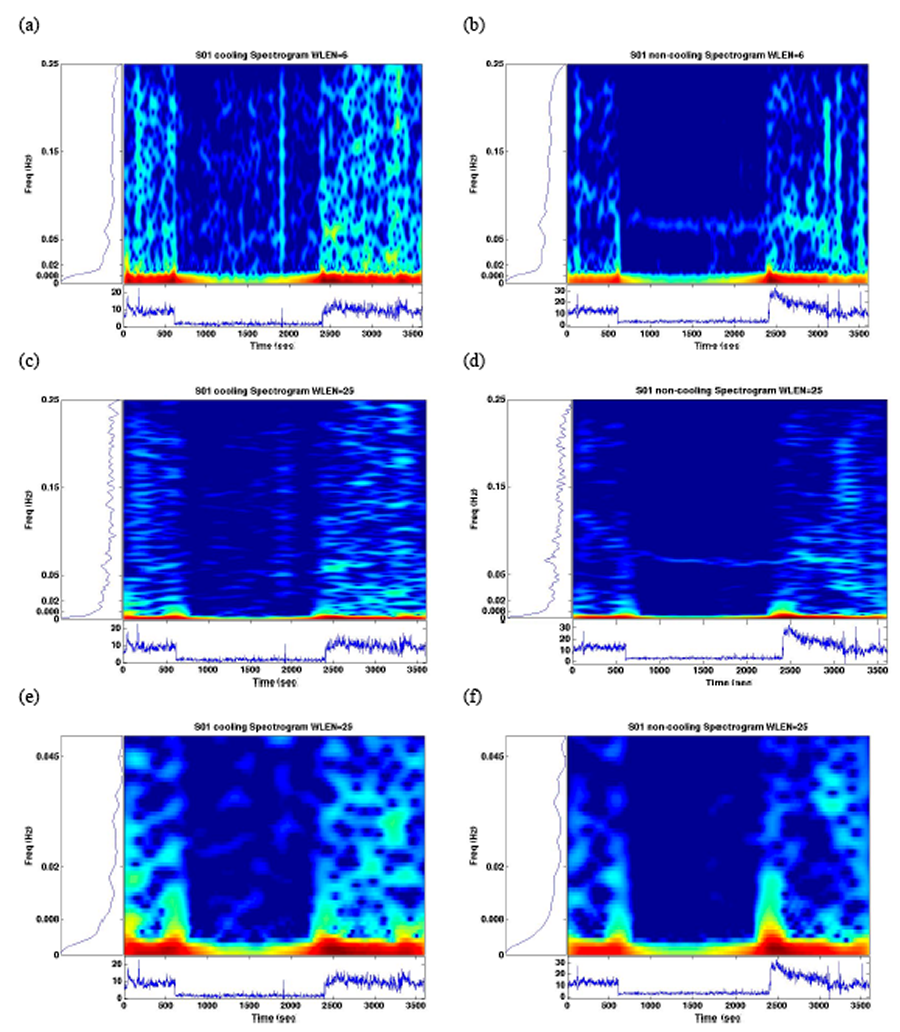
Figure 2: Subject S01 Spectrogram (Click for larger view)
Figure 2 is a typical spectrogram of both cooling and non-cooling test sessions from one subject. By comparing the spectrogram between using window lengths of 64 and 256 points, we can identify high-intensity regions within specific frequency bands and time frames. The spectrogram also showed that whenever there is subject movement during testing, high-intensity responses appear in all frequency ranges. In both cooling and non-cooling, the highest density spectrum was noted in the range below 0.008Hz and there is no known corresponding mechanism to this range. Among our four target frequency bands (0.008-0.25Hz), the highest density spectrum was noted in the range of the metabolic response. For non-cooling session, it is obvious that high intensity region occurs at the initial stage of reactive hyperemia (as seen on the time domain) within the range of metabolic response (figure 2 (f)); whereas the intensity remained similar after pressure relief in cooling (figure 2 (e)).
Power Spectrum of the Reactive Hyperemic Response
For the data from narrowband spectrogram, descriptive analysis showed that data from the metabolic and respiratory response ranges were normally distributed, and that of myogenic and neurogenic response ranges were not. For the wideband spectrogram, descriptive analysis showed that only data from the respiratory response range was normally distributed and others were not. The results showed that there was no significant difference in baseline between the two sessions (cooling vs. non-cooling) in all frequency bands (WLEN=64: metabolic p=0.393, neurogenic p=0.878, myogenic p=0.333, respiratory p=0.338; WLEN=256: metabolic p=0.445, neurogenic p=0.527, myogenic p=0.370, respiratory p=0.074). For the normalized post-occlusion energy ratio, the overall results showed that it was higher in non-cooling than in cooling in the metabolic frequency band, and lower in the respiratory band. However, these differences were not significant (p>0.05) (table 1).
Mechanism |
WLEN |
Cooling (mean ± standard deviation) |
Non-cooling (mean ± standard deviation) |
P value |
|---|---|---|---|---|
Metabolic |
64 |
93.51 ± 39.14 |
115.52 ± 64.49 |
0.310 |
256 |
121.74 ± 95.52 |
149.40 ± 206.36 |
0.799 |
|
Neurogenic |
64 |
141.53 ± 82.94 |
144.57 ± 135.08 |
0.721 |
256 |
147.73 ± 93.45 |
149.69 150.78 |
0.508 |
|
Myogenic |
64 |
182.23 ± 129.28 |
165.53 ± 184.52 |
0.575 |
256 |
187.22 ± 134.32 |
180.62 ± 212.06 |
0.575 |
|
Respiratory |
64 |
193.12 ± 134.33 |
101.49 ± 59.84 |
0.052 |
256 |
197.14 ± 132.99 |
105.35 ± 65.23 |
0.050 |
DISCUSSION
Short-time Fourier transform has been used in various fields for decades, and our results suggested that we could adopt this method to decompose the skin blood flow signal, and further investigate the underlying mechanisms associated with cooling for improved tissue tolerance under prolonged pressure. The spectrogram provides information on skin perfusion in both time and frequency domains; and by using different window lengths, we can compare and combine the spectrograms to locate the high-intensity spectrum during specific time periods and within certain frequency bands. Our previous study investigated only the time domain parameters of the reactive hyperemic response, and the results showed that only the normalized peak of reactive hyperemia is significantly lower in cooling compared to non-cooling. However, the overall perfusion response (i.e. perfusion area) (2) was not different. Wilkin (6) found that reactive hyperemia is mainly composed of metabolic and myogenic mechanisms; and so far, there was no rationale of enhanced respiration related to decreased reactive hyperemic response. Our results of overall decrease in normalized post-occlusion spectrum under local cooling indicate that metabolic mechanism might be attenuated with local cooling. A larger sample size might be required to reach the statistical significance. STFT provided us information on the changes specifically associated with different physiological response with local cooling application. Further analysis and interpretation is needed to draw more specific conclusions and to evaluate the clinical utility of this cooling strategy.
CONCLUSION
We have adopted the broadly used STFT to analyze the skin blood flow data under the combined stimuli of localized pressure and cooling. Our results showed that the spectrogram allowed us to compare the difference between cooling and non-cooling within different frequency bands of physiological responses. This provides us information on changes of specific physiological response under the stimuli. Findings from this study may lead to further discovery concerning the mechanisms associated with local cooling of tissue relative to its ability to enhance pressure tolerance and prevent pressure ulcers.
REFERNCES
- Kokate, J.Y., et al. (1995). Temperature-modulated pressure ulcers: a porcine model. Arch Phys Med Rehabil, 76, 666-73.
- Tzen, Y. (2008). Effects of local cooling on skin perfusion response to pressure: implications to pressure ulcer prevention. University of Pittsburgh Electronic Dissertation Database, 2008.
- Ruch, R.C. & Patton, H.D. (1965). Energy metabolism. In 19th ed. Physiology and biophysics (pp. 1064). Philadelphia, PA: Saunders Pr.
- Bracic, M. & Stefanovska, A. (1998). Wavelet-based analysis of human blood flow dynmics. B Math Biol, 60, 919-35.
- Cohen, L. (1995).Time-frequency analysis. Englewood Cliffs, NJ: Prentice-Hall, Inc.
- Wilkin, J. K. (1987). Cutaneous reactive hyperemia: viscoelasticity determines response. J Invest Dermatol, 89,197-200.
ACKNOWLEGEMENTS
We would like to thank Dr. Arash Mahboobin for customizing the time-frequency analysis MatLab toolbox. This work was funded by the National Institute on Disability and Rehabilitation Research (NIDRR), Rehabilitation Engineering Research Center (RERC) on Spinal Cord Injury, Grant #H133E070024. The ideas and opinions expressed herein are those of the authors and not necessarily reflective of the NIDRR.
Author Contact Information
Yi-Ting Tzen, MS, University of Pittsburgh, 2310 Jane Street Suite 1300, Pittsburgh, PA 15203, Office Phone (412) 586-6916, EMAIL: yit10@pitt.edu